Making a Hive-Centered Map
I finally broke through my mental block on preparing the ashcan copy of Honeybees, so here is some more progress on the "Before Play" part of my outline. Here, we discuss making a game map.
Preparing the Map
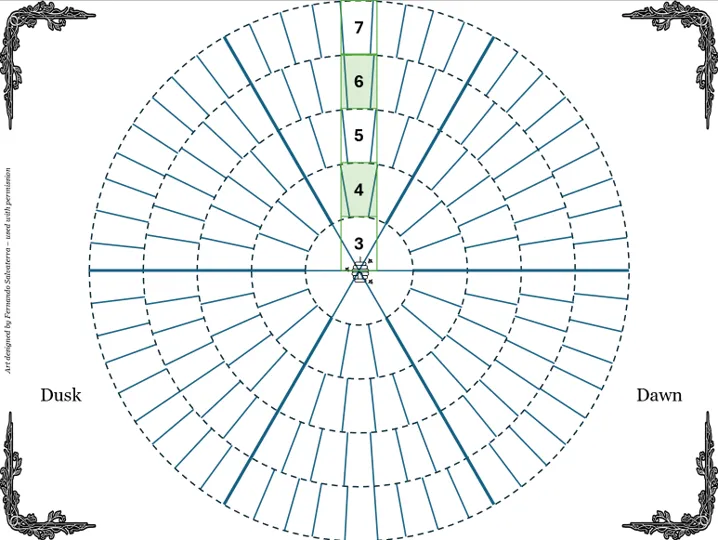
The map for this game is a 5-ringed circular bulls-eye centered on the players’ home hive. This circle is divided into 150 “flower patches” of equal area. This range corresponds to the common wisdom that honeybees tend not to scout or forage more than 5 miles or 10 kilometers from their hive. These two distances are obviously not equal, but both numbers are used as folk wisdom when discussing honeybee behavior. You are welcome to use either set of units; the important thing is that each range band corresponds to an incremental “Range Penalty”, which represents the metabolic cost of foraging that far from the hive. A blank map annotated with the default Range Penalties is included in the figure below.
There are 8 codified Biomes included in this rules text. Biomes reflect differences in microclimate in areas surrounding the hive; different Biomes provide varying levels of resources or animal activity at different times of the year. Regardless of what procedure used to generate the map, the map should provide a variety of Biomes to explore.
Biomes for Play
- Forest. Wooded areas that provide shelter from wind and rain within the canopy.
- Grassland. Sprawling, flat expanses of shrubs and grasses.
- Valley. Sheltered clefts and gorges hewn into the face of the earth.
- Town. Settled and developed areas, the homes of humans.
- Wetland. The swamps, marshes, and bogs that serve as cradles of life.
- Piedmont. The rolling foothills that bridge mountains and plains.
- Mountain. The high country, where shrubs and lichen compete for rocky footholds.
- Desert. Broad, arid landscapes of sand, clay, and rock pollinated by hardy foragers.
The natural rhythm of each Biome is driven by the Season, which determines the relative nectar scarcity and the flowers that players may pollinate.
Two example procedures for creating the map are included below. Both may be performed collaboratively at the table or before play by a host player.
Procedure 1: Real-World Map
One way to generate a game map is to start from a physical scaled map or digital satellite imagery. Find a topographically interesting place like your home town or a national park and trace out a 10 mile by 10 mile (or 20km by 20km) square. Then circumscribe a circle within that square and trace the broad contours of the geographical features that you see on the map into distinct Biomes.
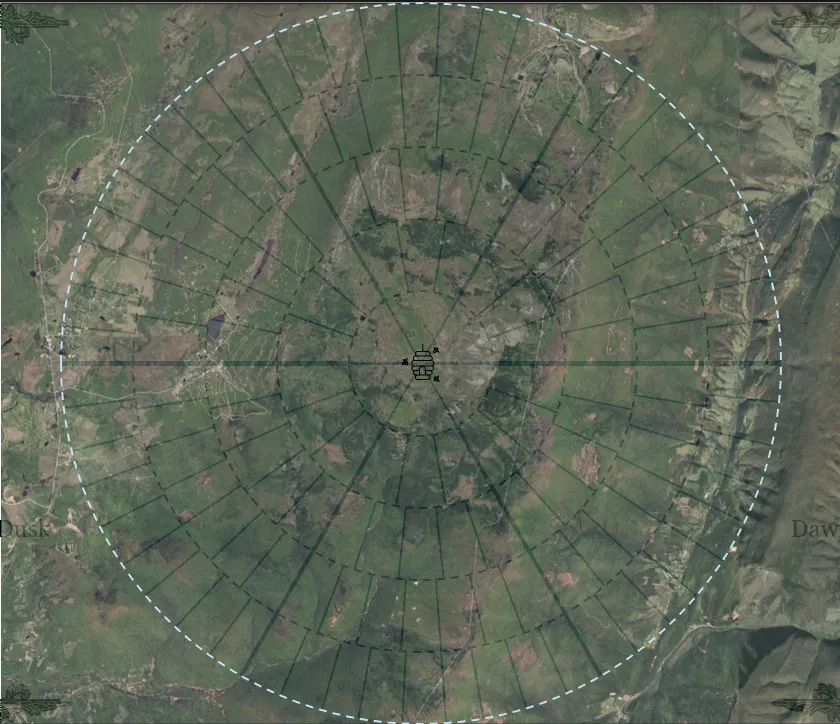 Image screenshotted from Google Maps
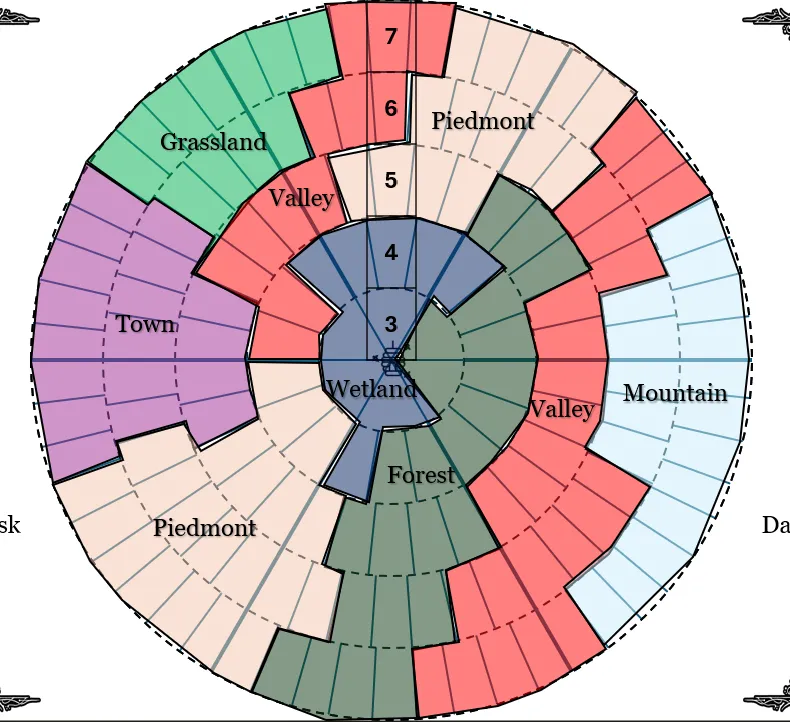
Transpose these contours onto a blank game map and massage the boundaries of the contours so that each flower patch only describes one Biome. As an example, the below game map was generated from a 10 mile by 10 mile area centered on the Dolly Sods Wilderness Area in West Virginia. The home hive is in a high-altitude bog which is surrounded by mountains, valleys, and foothills with a few small Appalachian towns and some cultivated farmland several miles away.
Procedure 2: Random Generation
You can randomly generate a game map with a 6-sided die (1d6), an 8-sided die (1d8), a blank map, and the below table which acts as a simple Markov process. Our objective here is to have somewhat naturalistic transitions between Biomes while also providing some variety in areas
| Current Biome | 1 | 2 | 3 | 4 | 5 | 6 | 7 | 8 |
|---|---|---|---|---|---|---|---|---|
| Forest | Forest | Grassland | Grassland | Valley | Piedmont | Piedmont | Mountain | Town |
| Grassland | Grassland | Forest | Wetland | Wetland | Piedmont | Piedmont | Desert | Town |
| Valley | Valley | Forest | Forest | Piedmont | Piedmont | Mountain | Mountain | Town |
| Town | N/A | N/A | N/A | N/A | N/A | N/A | N/A | N/A |
| Wetland | Wetland | Wetland | Wetland | Grassland | Grassland | Grassland | Grassland | Town |
| Piedmont | Piedmont | Forest | Grassland | Valley | Mountain | Mountain | Desert | Town |
| Mountain | Mountain | Forest | Valley | Valley | Piedmont | Desert | Desert | Town |
| Desert | Desert | Grassland | Grassland | Piedmont | Piedmont | Mountain | Mountain | Town |
Begin at the center of the map and choose any home Biome for the player beehive other than a “Town”. Roll 1d6 and 1d8 and sum the die faces to determine how many flower patches the home Biome occupies. Fill in that number of adjacent flower patches, starting from the center patch indicated by the result on the 6-sided die, as shown in the inline image.
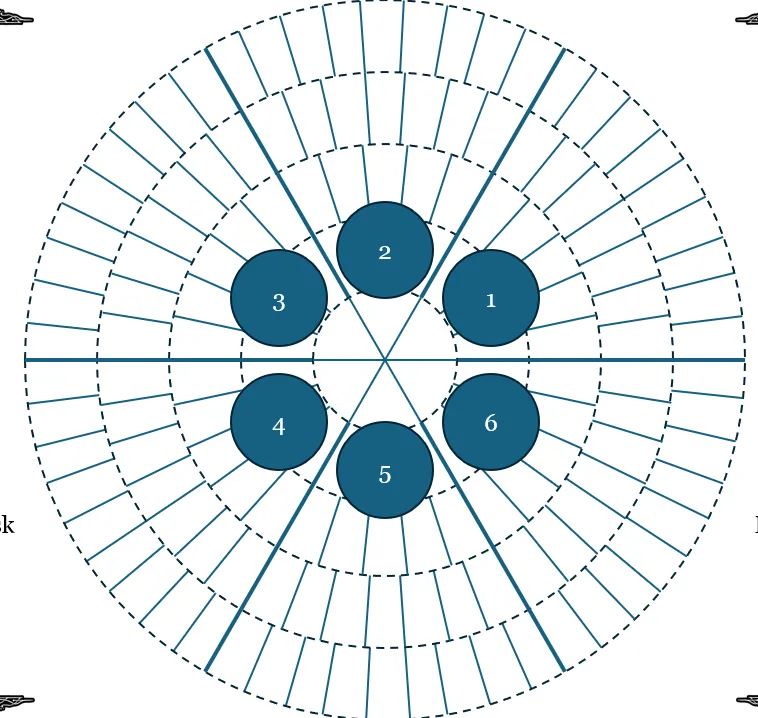
Now, roll 1d6 and 1d8 again. The 1d8 result tells you what the next Biome will be based on the table row indicated by the current Biome, the 1d6 result tells you which direction to start filling in flower patches, and the sum of the two dice tells you the number of patches to fill in.
- If the d8 result shows 8, then you have created a new “Town” on the map. Any Biome may abut a “Town”, so it is considered a terminus for this Markov process; return to another flower patch with unfilled adjacent patches and repeat this step from the Biome described by that patch.
- If the d8 result showed 1-7, then repeat this step until all patches on the map are assigned to a Biome
Example: Alice has just filled in five “Piedmont” patches. She rolls 1d6 and 1d8, showing 6 and 7, respectively. She looks at the “Piedmont” row and sees that a 7 result indicates that the next flower patches will be “Desert” patches. Because the 1d6 result shows 6, she looks for an adjacent unfilled patch to the southeast of the area she just filled. If there are none, then she just starts filling in patches adjacent to her “Piedmont”. Because the sum of the two dice is 13, she fills in 13 “Desert” patches, each of which must touch another.
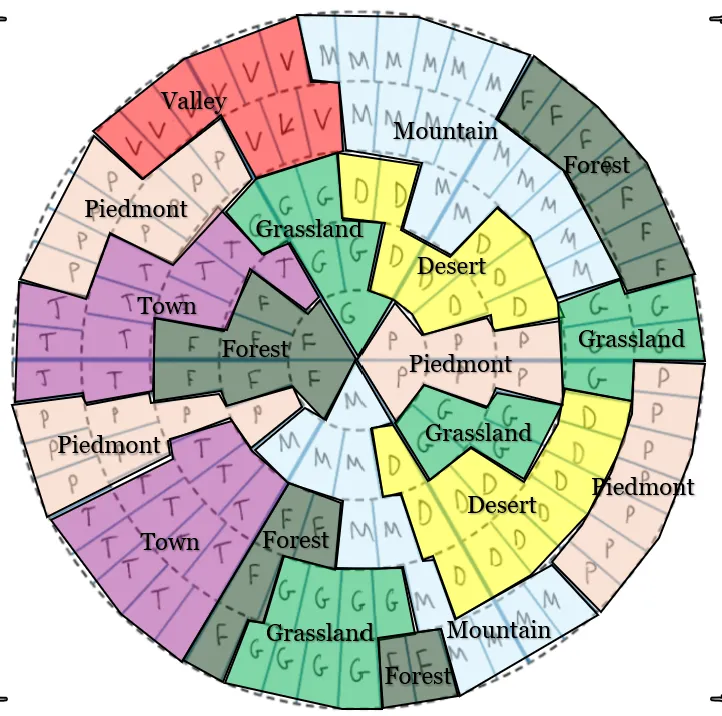
An example game map produced by this procedure is shown below:
Notes
This was a fun little activity to do over lunch. It took about 5 minutes - obviously filling out 150 tiles with an average die result of 8 takes a little bit of time but it helps to spread little microclimates around the map. I like using simple Markov processes to condition my procedural generation, and this one is fairly low overhead other than remembering that Towns are a terminus point. I took inspiration from Mythic Bastionland and Prismatic Wasteland's Chain Stocking the Hex Map - I'm sure you could come up with another baker's dozen ways to fill out our bull's-eye here but this feels like a good starting point. My biggest concern is that the results that tend toward the higher side of the d8 (deserts and mountains) risk taking up a lot of real estate since the d8 result also contributes to the number of patches. If I do a rewrite on this, I might fiddle around with the table order just to make the biomes average out a little more in size.